
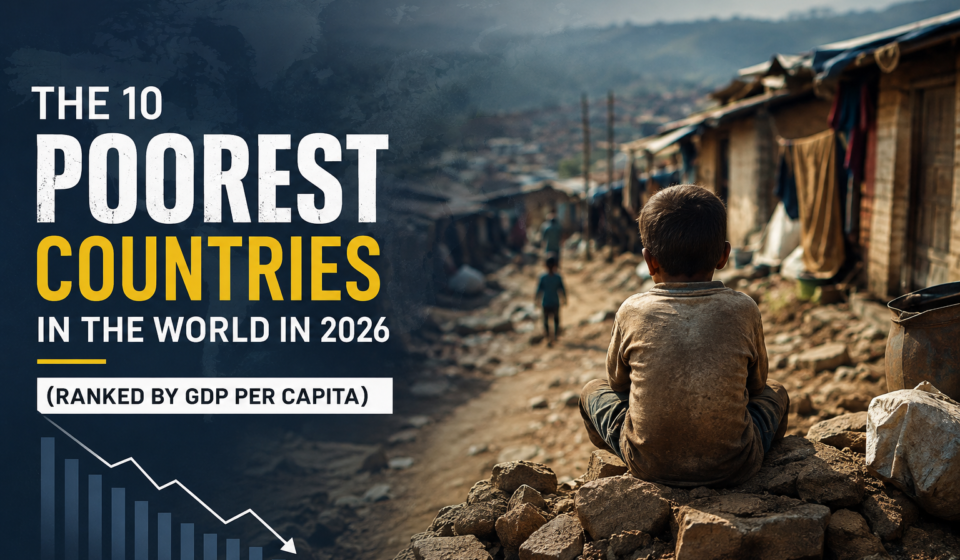

Money doesn’t tell the whole story of poverty, but it’s still the number everyone reaches for first. When economists rank countries by how “poor” they are, the standard yardstick is GDP per capita — a country’s total economic output divided by its population. It’s an imperfect measure (it says nothing about how income is actually distributed), but it remains the most widely used starting point, and it’s what this list is built on.
Using the International Monetary Fund’s April 2026 World Economic Outlook projections, here are the ten countries with the lowest nominal GDP per capita in the world this year.
Ranked List: 10 Poorest Countries by GDP Per Capita (2026)
| Rank | Country | GDP per Capita (Nominal, 2026) | GDP per Capita (PPP) |
|---|---|---|---|
| 1 | Yemen | ~$384 | ~$1,596 |
| 2 | South Sudan | ~$488 | ~$1,540 |
| 3 | Burundi | ~$546 | ~$1,031 |
| 4 | Central African Republic | ~$613 | ~$1,468 |
| 5 | Mozambique | ~$632 | ~$1,699 |
| 6 | Madagascar | ~$656 | ~$2,106 |
| 7 | Malawi | ~$733 | ~$1,797 |
| 8 | Somalia | ~$813 | ~$1,956 |
| 9 | Niger | ~$822 | ~$2,232 |
| 10 | Sudan | ~$864 | ~$2,451 |
Figures are IMF projections, rounded to the nearest dollar.
1. Yemen — ~$384 per person
Yemen tops this list, and it’s not a subtle case. Years of civil war have fractured the country’s institutions, wrecked infrastructure, and split control of the economy between rival authorities. Oil production, once a major revenue source, has fallen sharply, while chronic electricity shortages and water scarcity choke off ordinary economic activity. Even getting goods across the country reliably has become a logistical challenge because of the conflict.
Yemen’s ranking here reflects a macroeconomic projection more than a snapshot of daily life — the last comprehensive nationwide poverty survey dates back over a decade, well before the war intensified. Whatever the real household-level picture looks like today, it’s almost certainly worse than the older data suggests.
2. South Sudan — ~$488 per person
South Sudan is the world’s youngest country, having gained independence in 2011, and it’s struggled with instability for most of that short history. The economy leans almost entirely on oil — it accounts for the overwhelming majority of government revenue — which makes South Sudan’s fortunes hostage to two things it doesn’t fully control: global oil prices and the condition of export pipelines running through neighboring Sudan, which have been disrupted by that country’s own conflict.
By the UN’s Human Development Index, South Sudan sits at the very bottom of the global rankings, reflecting not just low income but weak outcomes in education and health as well.
3. Burundi — ~$546 per person
Burundi is a small, landlocked, densely populated country in East Africa, and its economy is still overwhelmingly agricultural. That’s a problem when the amount of usable farmland per household keeps shrinking as the population grows. Limited industrialization and patchy access to electricity mean there’s little else to absorb workers moving off the land.
Notably, Burundi actually ranks as the single poorest country in the world when GDP is adjusted for purchasing power (PPP) rather than measured at market exchange rates — a reminder that “poorest” genuinely depends on which yardstick you use.
4. Central African Republic — ~$613 per person

The Central African Republic is a case study in resource wealth not translating into shared prosperity. The country has meaningful timber and diamond reserves, but decades of conflict and weak central governance have prevented that wealth from reaching most of the population. Being landlocked adds another layer of difficulty, pushing up the cost of moving anything in or out of the country.
5. Mozambique — ~$632 per person
Mozambique has genuine natural-gas and mineral wealth, and on paper that should be a growth story. In practice, extractive industries tend to create relatively few jobs relative to the revenue they generate, and that wealth hasn’t translated into broad improvements in rural living standards. Add in periodic cyclones, an ongoing insurgency in the north, and limited farmland productivity, and you get one of the higher extreme-poverty rates on this list — recent World Bank survey data put it above 80%.
6. Madagascar — ~$656 per person
Madagascar’s economy runs largely on smallholder agriculture, and geography works against it: the island’s isolation raises the cost of getting anything to international markets, while cyclones and drought regularly damage crops. Weak infrastructure compounds the problem — even moving goods domestically between regions can be difficult.
7. Malawi — ~$733 per person

Malawi is landlocked and heavily dependent on rain-fed farming, which makes its economy unusually exposed to droughts and floods. A narrow export base — tobacco has historically dominated — combined with recurring foreign-exchange shortages and heavy public debt has limited the government’s room to invest in infrastructure or diversify the economy.
8. Somalia — ~$813 per person

Somalia has spent decades navigating fragmented governance and periodic conflict, which has left public infrastructure thin and investment scarce. Droughts and floods regularly threaten the agriculture and livestock sectors that much of the population still depends on. One nuance worth flagging: reliable household poverty-survey data simply doesn’t exist for Somalia the way it does for most other countries on this list, which is part of why remittances and mobile-money networks — both relatively strong there — don’t show up cleanly in the usual poverty statistics.
9. Niger — ~$822 per person

Niger sits mostly in the Sahara and Sahel, meaning an unusually arid climate limits how much of the country can support agriculture at all. It also has one of the highest population growth rates in the world, which means the economy has to expand just to keep per-person income from falling, let alone rising. Being landlocked adds further transport costs on top of everything else.
10. Sudan — ~$864 per person
Sudan rounds out the list, and its position here is almost entirely a story about the war that broke out in 2023. That conflict has destroyed productive infrastructure, displaced millions of people internally and across borders, and severely disrupted markets and public services. As with Yemen, the poverty-rate data available for Sudan predates the current crisis by over a decade, so it understates the real situation on the ground today.
Why Are These Countries at the Bottom?
No country ends up here for just one reason — it’s almost always several overlapping problems reinforcing each other.
Conflict is the single biggest factor connecting more than half the countries on this list. War doesn’t just destroy buildings and roads; it displaces workers, interrupts schooling for an entire generation, and redirects whatever public money remains toward security instead of services.
Weak institutions matter just as much as conflict, sometimes more. A country can have real natural resource wealth — as Mozambique and the Central African Republic do — and still see very little of it reach ordinary households if governance, revenue collection, and accountability are weak.
Dependence on rain-fed agriculture leaves several of these economies — Burundi, Madagascar, Malawi, Niger — highly exposed to weather. A bad rainy season isn’t just an inconvenience; it can be the difference between a stable year and a food crisis.
Being landlocked is a quieter but persistent drag. Burundi, Malawi, Niger, South Sudan, and the Central African Republic all face higher transport costs simply because they lack direct sea access, which raises the price of everything they import or export.
Rapid population growth also plays a role that’s easy to overlook. A country’s total economic output can genuinely grow year over year and still show falling GDP per capita if the population is expanding even faster — which is happening across much of Sub-Saharan Africa right now.
A Word on What GDP Per Capita Doesn’t Tell You
It’s worth being upfront about the limits of this ranking. GDP per capita is an average — it says nothing about how income is actually split within a country, and it can be skewed by a small, wealthy segment of the population or by a handful of large companies. A country’s GDP can also rise because of an oil boom or mining project that barely touches most people’s daily lives.
That’s why economists also look at other measures: GDP adjusted for purchasing power (which accounts for how far money actually stretches locally), the share of the population living below internationally recognized poverty lines, and the UN’s Human Development Index, which combines income with health and education outcomes. On some of those alternate measures, the rankings shift — Burundi, not Yemen, comes out lowest when adjusted for purchasing power, for instance, and South Sudan has the lowest Human Development Index score of any country tracked.
Is Escaping This List Possible?
Yes — and there’s a real precedent for it. Vietnam was among the world’s poorest economies as recently as the 1980s. A combination of economic reforms starting in 1986, deeper integration into global trade, and sustained investment in infrastructure and education helped move it into middle-income status within a few decades, lifting tens of millions of people out of poverty along the way.
The common thread among countries that manage this shift is usually some mix of: ending active conflict, building institutions that can actually deliver services and enforce contracts, investing in electricity and transport infrastructure, and diversifying the economy beyond one or two commodities. None of that happens quickly, but the list of “poorest countries in the world” has never been a fixed, permanent ranking — it changes as circumstances on the ground change.
Frequently Asked Questions
What is the poorest country in the world in 2026?
Yemen, with a projected nominal GDP per capita of roughly $384, according to IMF World Economic Outlook data for 2026.
Does GDP per capita actually measure poverty?
Not directly. It measures average economic output per person, not household income or how evenly that income is distributed. A country can have moderate GDP per capita and still have severe inequality or widespread poverty. Poverty rates and the Human Development Index give a more complete picture alongside GDP.
Why are most of the world’s poorest countries in Africa?
Nine of the ten countries on this list are in Sub-Saharan Africa. Common contributing factors include high population growth rates, dependence on rain-fed agriculture, limited infrastructure, ongoing or recent conflict, and — for several countries — the added transport costs of being landlocked.
Can a country move off this list?
Yes. Vietnam is the most commonly cited example of a country that transformed from one of the world’s poorest economies into a middle-income one within a few decades, through sustained reform, trade integration, and infrastructure investment.
Data sourced from the IMF World Economic Outlook (April 2026), with supplementary figures from the World Bank and UNDP Human Development Report 2025. Nominal GDP per capita is used as the primary ranking measure; figures are rounded projections and can shift with exchange rates, conflict, and revised national statistics.